Then drag'n'drop files below (if payment id above is missing or invalid, most features are unavailable):
To generate a Dependency Structure Matrix analysis of a GraphViz file (.gv or .dot), or JVM code, drag 'n' drop GraphViz files or JVM (Java / Scala / Kotlin / Groovy etc.) jar files here, or click this box to select one
Email contact@probot.llc for special requests (such as analysis of other graphs or languages), for more help or to upgrade.
Please ensure that popups are permitted for unstuck.dev. The drag'n'drop zone below opens a new tab for each dropped file, requiring popups.
Example GraphViz files (from GraphViz test graphs):
- Small graph; acyclic (47 nodes; 55 edges): unix2k.gv
- Medium graph with cycles (79 nodes; 281 edges): b124.gv
- Large graph; acyclic (1463 nodes; 5806 edges): b100.gv
Example jars:
- Medium jar (2407 nodes; 5429 edges): junit-4-13.2.jar
- Large jar (45116 nodes; 144048 edges): scala-library-2.13.10.jar
- only the first 10k out of 45116 nodes display when all groups are fully expanded
- expect ~10 seconds server-side, ~40 seconds client-side rendering; please wait
- the paid version can collapse groups to handle the complexity
Quick start
After drag'n'dropping a jar onto the purple rectangle above, namespaces aka packages aka groups will be split wherever possible to eliminate cycles. The new package names will have =0 suffixed for the first split, =1 suffixed for the second split, etc.
Search for these splits and make the corresponding changes in the underlying code to eliminate the cycles!
Privacy
No graph information is stored server-side, making this tool safe for corporate use. Server logs do not contain any graph information. If more detail is required, please email contact@probot.llc.
Terminology
Dependency Structure Matrices
A Dependency Structure Matrix (DSM) can be used to show an edge adjacency matrix of the dependencies in your code. Least-fundamental nodes are at the top and most-fundamental nodes are at the bottom. The rows and columns have the same content. Dependencies above the diagonal indicate cycles (which are undesirable); reorder rows to eliminate them!
See dsmweb.org for more information about Dependency Structure Matrices. They help manage software complexity by showing causality graphs (what can break what) and more importantly, which parts of a codebase are entangled in a cyclic dependency. They also show you which links maintain the cycle, showing you how to resolve it in a way that is typically infeasible without a Dependency Structure Matrix.
Cycles
DSMs allow cycles (really strongly connected components) of your code to be visible and provide an easy way to see how to break these cycles, typically by splitting groups. Reducing the size of the largest cycle in your code allows the code to be parsed, tested and understood in smaller increments; cycles need to be either fully parsed or not parsed by humans and computers alike. Cycles involving more than 1000 lines of code should typically be split, as humans struggle to keep this much complexity completely and accurately modeled in their minds in one go.
Groups
Some languages use the term namespaces, some use the term packages for grouping code together. Here, we use the term groups to be language-neutral.
Splits
Splitting a group up can be an effective way to break cycles involving groups that have very fundamental and very non-fundamental code together. Dependency Structure Matrices generated here split groups wherever possible, denoting each split with a suffix containing = followed by a unique integer, starting at 0, incrementing upwards. These split groups are termed splits here.
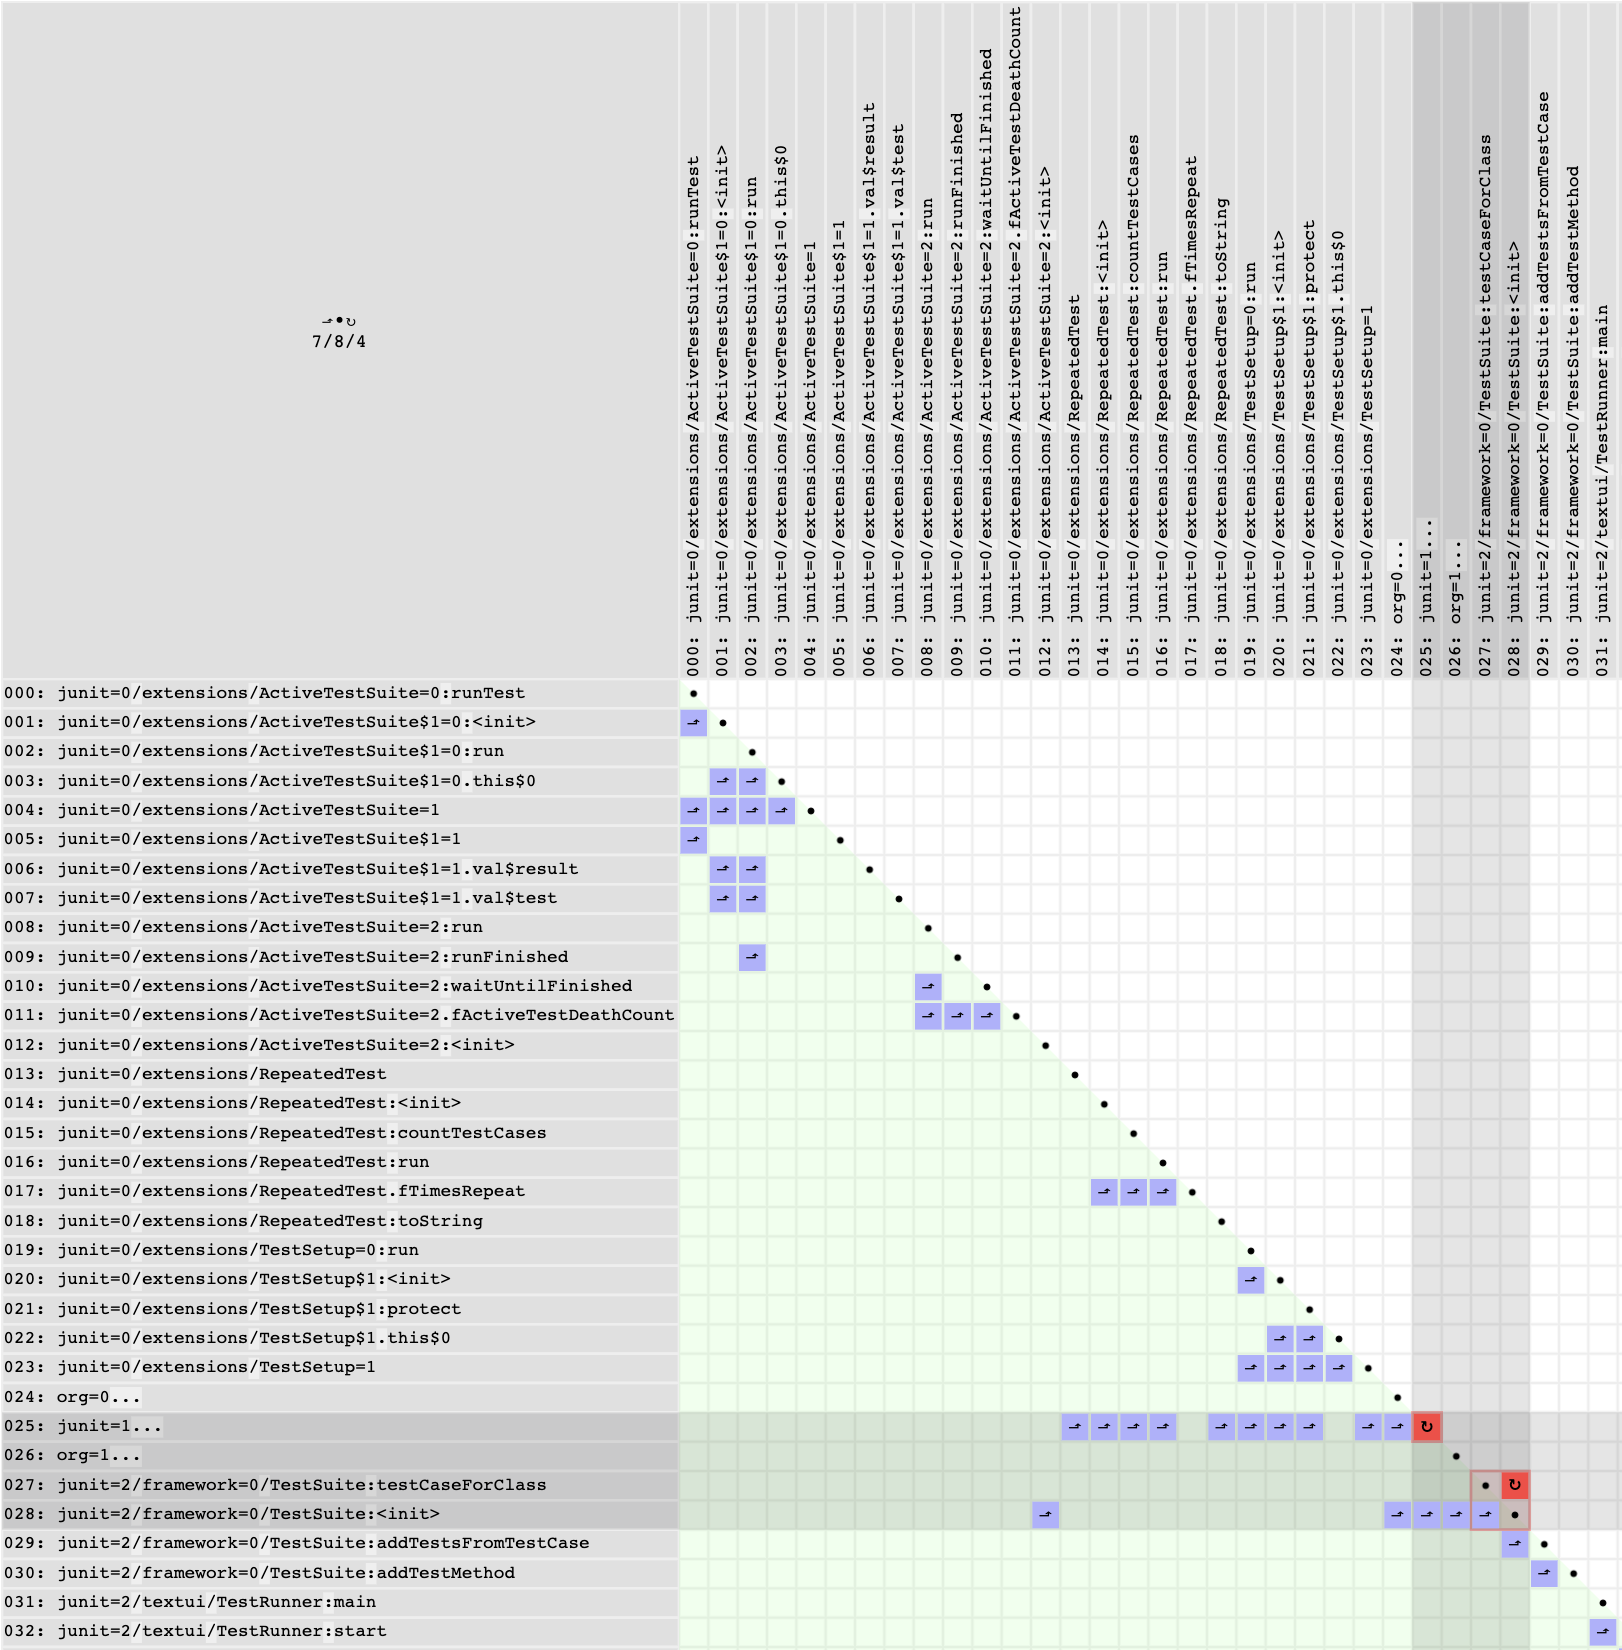
Key metrics visible in the corner cell
The corner cell displays 3 numbers separated by / symbols. These 3 numbers should all be driven towards zero. They are:
- The total number of visible splits in the codebase (7 in the example image below)
- The total number of cycles if all groups are fully expanded (8 in the example image below)
- The total number of cycles currently visible (if some groups are collapsed) (4 in the example image below)
In the paid version, press [C] to have no split groups, with as few cycles as possible. Press CTRL-[Z] to see the graph if the suggested groups were split. Manually move nodes by left-clicking and dragging to select and right-clicking a destination row to reduce the number of split groups. Right-clicking a destination row moves the selected rows to be under that row. The destination row can be the header row or corner cell to move rows to the start.
In the example that follows, some collapsed groups are highlighted (highlighting, moving and collapsing nodes requires the paid version):
Limitations
Dependency Structure Matrices produced here have a 10000 node count limit. Note that GraphViz (dot) already takes more than an hour for 1000 nodes and 10000 edges on modern hardware, typically producing an unintelligible result. 10k nodes requires ~100x the computational workload of 1k nodes and we typically process these in ~10 seconds server-side with ~40 seconds client-side rendering, or >6000x faster than GraphViz. Please email contact@probot.llc for options to achieve your complexity management goals if this is limiting you. Most monitors aren't 10k yet anyway, so that is probably your real limitation!
Large Dependency Structure Matrices can crash the page in the browser when editing in paid mode. If this occurs, just refresh the page, as the state is stored client-side. No graph state is stored server-side.
Free account features
Hover over the corner cell for a detailed explanation of the [split groups]/[total cycles]/[visible (grouped) cycles] displayed there.
Features below help you reduce the size of your biggest cycles by splitting as few groups as possible!
CTRL and CMD (⌘) both work the same way on Mac!
- [B]: toggle cycle boxes
- [H]: toggle succinct headers
Additional paid account features
Click on '.' to collapse a group or '...' to expand it.
Group (aka namespace aka package) separators recognized: .:;[/
- CMD-SHIFT-[Z]: redo
- CMD-[Z]: undo
- [U]: toggle visibility: undo buffer usage
- [V]: toggle visibility: node and edge count
- CMD-[D]: download nodes as json
- CMD-[E]: download nEwline-separated nodes, always ending with a newline character
- CMD-[J]: download edges as json, omitting unconnected nodes, ignoring grouping
- CMD-[G]: save edges as GraphViz, omitting unconnected nodes, ignoring grouping
- [X]: zoom out by a factor of 2
- SHIFT-[X]: zoom in by a factor of 2
- [C]: resolve all cycles possible without splitting groups
- CMD-[.|>]: fully expand all groups for all nodes
- CMD-[,|<]: fully collapse all groups for all nodes
- [8]: truncate start
- [5]: untruncate start
- [9]: truncate end
- [6]: untruncate end
- [=]: truncation reset
- [/|?|÷|F1|SPACE]: display help
- [MOUSE]: left-click then either drag or SHIFT-left-click to select; then right-click the destination row to move after